
Seven colonies, 50 adult penguins from each, and more than 1,100 km between the two farthest apart. That was the scale of a little penguin DNA study presented in 2007 by Rebecca Overeem and colleagues from Deakin University’s Warrnambool campus, Phillip Island Nature Parks and New Zealand’s University of Otago. The St Kilda breakwater was one of the seven.
The question behind it is one our visitors still ask on the boardwalk beside St Kilda Pier. Are these penguins their own little population, or part of something much bigger? The answer turned out to be clearer than you might expect, and it says a fair bit about how a city colony should be looked after.
The old slide file from that talk used to live on our site. We’ve retired it and rewritten the story in plain language, checked it against the peer-reviewed paper the work became, and added what it means for the birds on the rocks at St Kilda.
Why researchers went looking at little penguin DNA
Little penguins are the smallest penguins on the planet. The presentation put an adult at about 33 cm tall and roughly 1 kg, breeding for the first time at two to three years old and living six to seven years on average. They occur only in southern Australia and New Zealand. On the Australian side the range runs from Fremantle in Western Australia around to northern New South Wales and Tasmania.
Victoria alone held about 40,000 breeding pairs at the time, with the largest colonies on Phillip Island and Gabo Island. Plenty of birds, then. So why worry?
The researchers gave three reasons the question mattered for conservation:
- human-induced pressure on colonies;
- the possibility that birds rarely move between colonies, which would leave small colonies to fend for themselves;
- visible differences between colonies, raising the chance that each one is adapted to its own local conditions.
The published paper adds a nice bit of tension. Penguins from different south-eastern colonies differ noticeably in body shape and ecology, which hints at separate populations. Yet flipper banding had caught some birds turning up at colonies other than their own, if only now and then. If you’ve ever wondered how researchers tell individual penguins apart, banding is the backbone of it.
DNA was the way to test which picture was closer to the truth. The formal aim was to measure how much breeding exchange happens between colonies, starting from the idea that they work as a “meta-population”: a network of local groups linked by birds that move and breed somewhere new.
Seven colonies from Kangaroo Island to Gabo Island
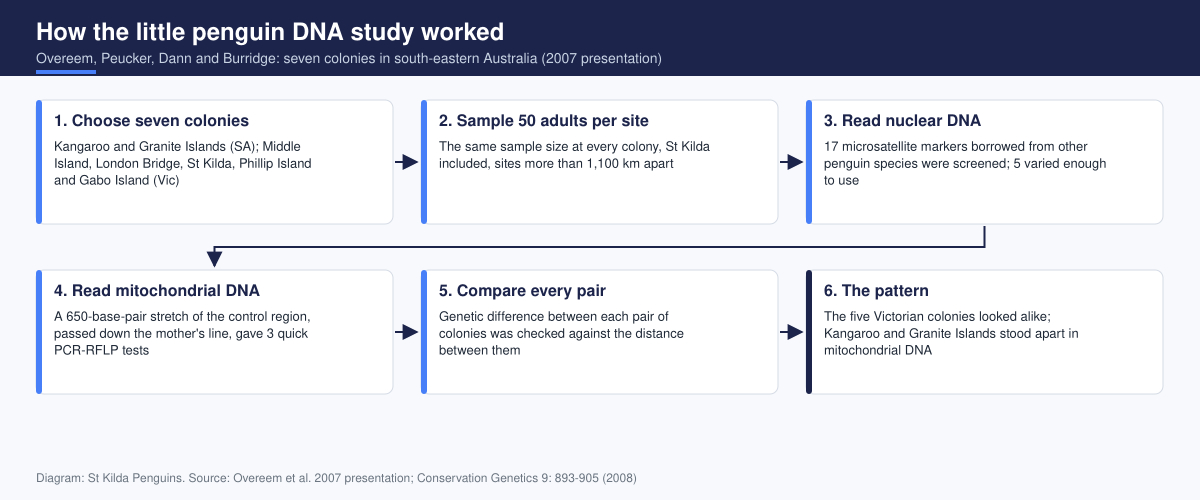
The team sampled 50 adult penguins at each of seven sites. Running from west to east, they were:
- Kangaroo Island, South Australia
- Granite Island, off Victor Harbor in South Australia
- Middle Island at Warrnambool
- London Bridge, near Port Campbell on the Great Ocean Road
- St Kilda, on Port Phillip
- Phillip Island
- Gabo Island, off Mallacoota near the New South Wales border
That spread takes in offshore islands and mainland headlands, some of the biggest colonies in the south-east and much smaller ones. St Kilda was the only one of the seven inside a capital city.
Equal sample sizes matter more than they sound. With 50 birds from every site, a difference between two colonies is far less likely to be a quirk of one place being sampled more heavily than another. And because the sites stretch across two states, the design could pick up a gradual change along the coast as well as a sharp break.
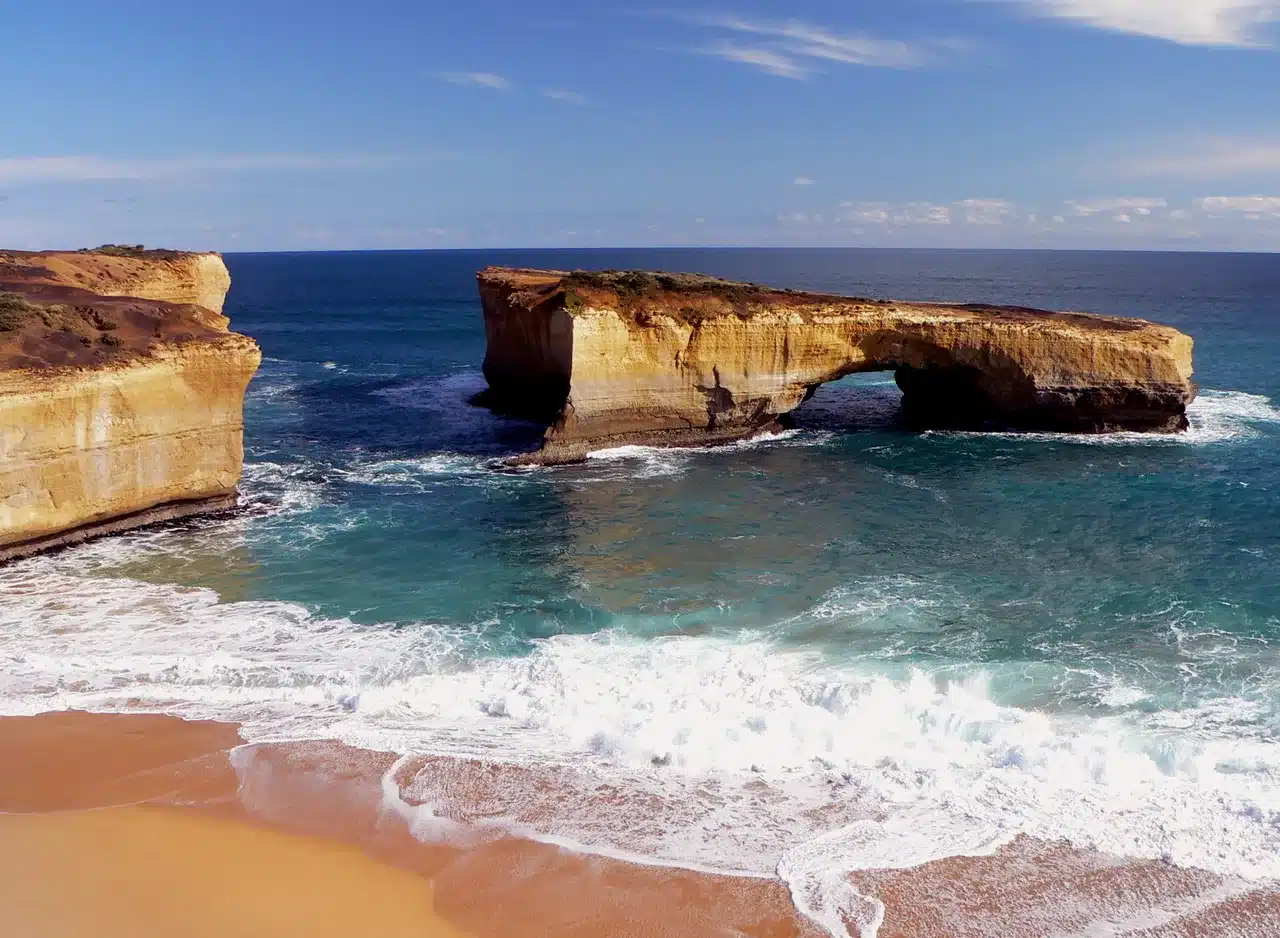
The London Bridge site takes its name from the famous rock formation, now usually called London Arch after its landward span collapsed in January 1990.
How the team read two kinds of penguin DNA
Studies like this rely on stretches of DNA that vary from bird to bird. The Deakin team used two kinds that behave quite differently, which is the clever part.
Microsatellites: the nuclear fingerprint
Microsatellites are short sections of nuclear DNA where a tiny motif, one to six base pairs long, repeats over and over. They’re scattered right through the genome, and the number of repeats differs between individuals, so they work a bit like a fingerprint for comparing populations. Each bird inherits them from both parents.
The team screened 17 markers that had originally been developed for other penguin species: four from Adélie penguin work by Roeder and colleagues (2002), six from Galápagos and Magellanic penguins by Akst and colleagues (2002), and seven from Humboldt penguins by Schlosser and colleagues (2003). Only five of the 17 varied enough in little penguins to be useful. Those five carried the nuclear side of the analysis.
Mitochondrial DNA: the mother’s line
Mitochondrial DNA sits in the mitochondria, the energy-producing parts of a cell. It passes down only through mothers, and it changes relatively quickly over evolutionary time. The team sequenced a 650-base-pair section called the control region, found six positions that varied, and turned them into three PCR-RFLP tests.
In plain terms, that means copying the stretch of DNA, then cutting it with enzymes that snip only at particular sequences. Each bird’s variant shows up as a different pattern of bands on a gel. It’s a far cheaper way to screen hundreds of birds than sequencing every one, and the paper notes that full control-region sequences were read for just two or three birds per colony.
What the little penguin DNA showed
The short version: most of the colonies looked alike.
The nuclear markers
Across the five usable microsatellites, the colonies were broadly similar. Only Kangaroo Island could be told apart from some of the others. Genetic difference showed no link to geographic distance, so colonies hundreds of kilometres apart were no more different than near neighbours. The routine quality checks held up as well. Every marker fitted Hardy–Weinberg expectations except one (G2-2) at Kangaroo Island, and results at different markers were independent of each other.
The mitochondrial DNA
Every colony carried more than one mitochondrial type. Here the split was sharper. Kangaroo Island and Granite Island, the two South Australian colonies, were distinct from the Victorian colonies. When the team plotted difference against distance, the relationship came very close to statistical significance, with a Mantel test p-value of 0.054, just shy of the usual 0.05 cut-off.
Where St Kilda sits
St Kilda fell squarely inside the Victorian group. Genetically, our breakwater birds looked like the penguins at Middle Island, London Bridge, Phillip Island and Gabo Island. There was no sign of a separate city strain.
The paper that followed, Contrasting genetic structuring between colonies of the World’s smallest penguin, confirmed the overall picture with 50 birds per colony. It found no deep family-tree structure in the mitochondrial sequences, very similar microsatellite and haplotype frequencies across most colonies, and a break between the two westernmost colonies and everything to their east.
Why the western colonies stand apart
Finding a pattern is one thing. Explaining it is where the paper, published in Conservation Genetics, earns its keep.
For the Victorian colonies looking so alike, the authors offered two explanations:
- Low but steady gene flow today. A small, consistent trickle of birds breeding away from home, generation after generation, is enough to stop colonies drifting apart genetically.
- A recent founding event. Colonies in the Bass Strait region may have been established relatively recently, after the last marine transgression (the rise in sea level that followed the last ice age), and simply haven’t had time to diverge.
The data fit either story, and the abstract leaves both on the table.
The western break they put down mainly to sea surface temperature. Water temperature changes along the coast, and with it the timing of breeding. A penguin that settles at a colony running on a different seasonal schedule may struggle to breed there, so even when birds do travel, their genes don’t spread far. The paper describes breeding timing as hindering “genetically effective migration”.
We like this finding because it shows the ocean shaping these birds well beyond what’s on the menu. We’ve written about how weather and sea temperature change penguin foraging trips; here, sea temperature seems to shape family trees too. For a sense of the timetable the St Kilda birds keep, our penguin calendar and seasonal life cycle lays out the year.

What it means for protecting an urban colony
Here’s where we part company with a reading of this study we’ve heard more than once. If St Kilda’s birds are genetically the same as Phillip Island’s, the argument goes, the breakwater colony is a pleasant extra rather than something that matters. We reckon that gets it backwards.
Genetic similarity tells you birds have mixed over many generations. It doesn’t promise that a struggling colony will be topped up next season. The paper’s own phrase is “low but consistent” gene flow, and low is the word to notice. Our reading is that the breakwater’s population of about 1,400 penguins rises or falls mostly on its own breeding success, chick by chick and year by year.
That puts the weight back on the local threats people can actually fix. Off-leash dogs near the breakwater, discarded fishing line and bright lights at dusk all chip away at that breeding success. It’s also why long-term records are worth so much. Banding and regular monitoring are the tools that can show, over years, whether birds are moving in or out, and our guide to comparing colony size and monitoring at St Kilda and Phillip Island explains how the two colonies are tracked.
There’s a flip side worth saying plainly. Because St Kilda belongs to a wider, connected Victorian gene pool, it isn’t a genetic dead end. Birds raised on the breakwater carry the same heritage as birds from Warrnambool to Gabo Island, and the occasional bird moving between colonies keeps that network linked. Protecting St Kilda protects a working part of the system.
The 2007 slides ended with a to-do list: more microsatellite markers, plus samples from Tasmania, New South Wales, Western Australia and New Zealand. The Phillip Island Nature Parks research programme, where co-author Peter Dann was based, lists follow-up genetic papers by Chris Burridge and colleagues from 2015. Viewing at the St Kilda breakwater today runs as free ticketed sessions managed by Phillip Island Nature Parks.
Frequently asked questions
Where was the little penguin DNA research published?
In the journal Conservation Genetics, volume 9, pages 893 to 905. It appeared online in September 2007 and in print in 2008, with Christopher Austin joining Overeem, Peucker, Dann and Burridge as a co-author. The work was partly funded by Deakin University, the Holsworth Wildlife Research Fund, the Norman Wettenhall Foundation, the Australian Research Council and Phillip Island Nature Parks.
Does genetic sameness mean penguins regularly swap colonies?
Not necessarily. Similar DNA can come from a small but steady trickle of movers over many generations, or from colonies founded recently from the same source. Flipper banding had already shown that birds do move between colonies, but only infrequently.
Are St Kilda’s penguins genetically different from Phillip Island’s?
Not in this study. St Kilda grouped with the other Victorian colonies, Phillip Island included. Only the two South Australian colonies stood apart, and mainly in their mitochondrial DNA. So the next time a penguin hops up the rocks at dusk, you’re watching a bird that shares its genetic heritage with colonies from Warrnambool all the way to Gabo Island.