
Two hundred and sixty-two nests, an estimated 1,215 birds and 248 new microchips. That is the 2009-10 season on the St Kilda breakwater in three numbers, and this page is our plain-English rewrite of the St Kilda penguin report that recorded them. The original was a short Word document by Zoe Hogg, summing up the volunteer monitoring team’s season.
First, a note on dates. Older links to a 2010-11 report and to a separate breakwater penguin report also lead here. Those files were never archived, so we have nothing reliable to quote from them. Every figure on this page belongs to the 2009-10 season, and the colony’s monitoring year ran from May through to the following April.
It was a good year for the people putting in the hard yards. The team lost only one monitoring session to bad weather, and the report notes there were always plenty of volunteers on hand on monitoring nights.
262 breeding sites across three stretches of wall
The breakwater was split between three monitoring teams, each covering a similar length of rock. Positions along the wall were logged against letters painted on the rocks; the old site’s notes describe them as 20 metres apart along a breakwater roughly 400 metres long. That lettering comes up again later, because a few letters had some very catchable penguins.
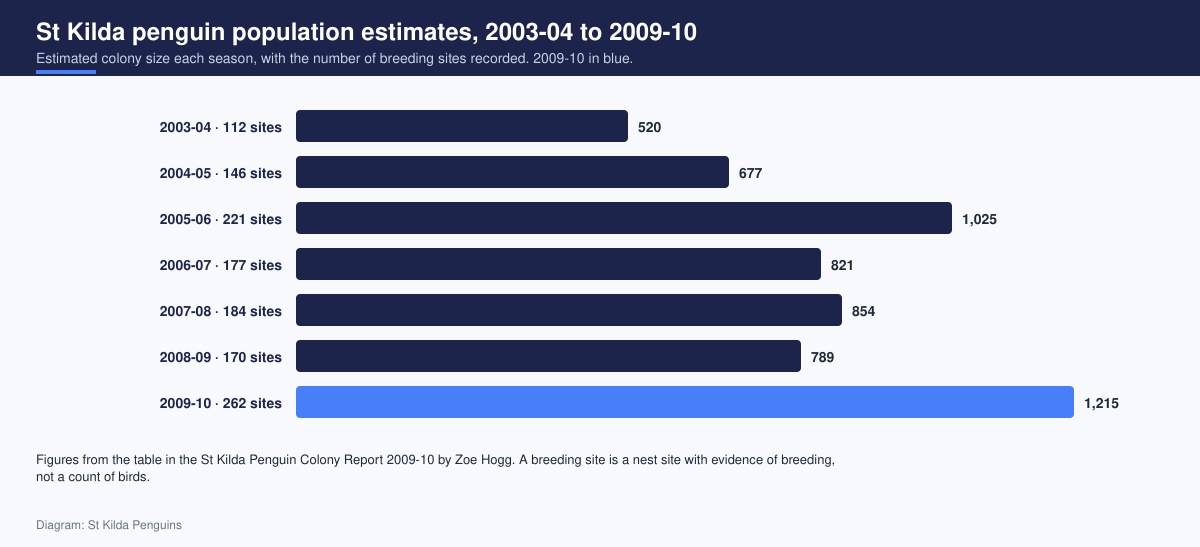
Evidence of breeding turned up at 262 sites that season. By area, it looked like this:
- Area one, the stretch closest to the kiosk: 111 breeding sites
- Area two: 87 breeding sites
- Area three: 63 breeding sites
Those three add up to 261, one short of the headline figure. The report doesn’t explain the gap. We’d rather point it out than quietly smooth it over.
Either way, 262 was a big number for this colony. The report’s own table shows 170 breeding sites the season before and a previous high of 221 in 2005-06. Go back to 2003-04 and the count was 112, so recorded breeding on the wall had more than doubled in six seasons.
Area three was also about to change. Works were under way to extend it and give yachts more shelter, and the report saw a possible upside for the birds: a calmer stretch of water might make an easier landing spot for penguins coming ashore. Hogg expected breeding patterns to shift over the following two seasons. Whether they did, this report can’t tell us, and the later reports are among the files that were never archived.
Reading the population estimate of 1,215
Breeding sites and population are different measures, and the gap between them is where most of the interest lies. A breeding site is a nest site with evidence of breeding. The population estimate is a separate figure for the colony as a whole. In the report it sits beside the season’s catch and sighting counts, although the method behind it isn’t spelled out.
For 2009-10 the estimate was 1,215. The season before, it was 789. The last time it came anywhere near this level was 2005-06, at 1,025.
If every one of the 262 breeding sites held a pair, that accounts for roughly 520 breeding adults. So more than half the estimated population wasn’t tied to a recorded nest. Some of those birds were probably young penguins yet to breed, which the microchipping figures below hint at. Others may have been adults that simply sat the year out, something we explain in our piece on why some St Kilda penguins skip a breeding season.
The catch figures show how much handling sat behind the numbers. Volunteers caught 574 individual adults and logged 986 captures in total, so plenty of birds were caught more than once. They also noted 1,323 adults seen but not caught.
Our take: a 54 per cent rise in the population estimate in a single season deserves a little caution. The extra breeding sites were real enough. But 2009-10 was also a season with almost no missed sessions and a much bigger evening guide presence on the wall, and more eyes find more birds. We’d read the estimate as strong evidence of a good season, not proof that the colony grew by more than 400 penguins in twelve months.
Lighter penguins, but remarkably steady weights
The report’s verdict on condition was mixed. The penguins were lighter than usual, yet their average weight held very steady through the year. Two charts embedded in the original document let us put numbers on that.
Month by month, average male weights in 2009-10 ran from 1,147 grams in May to 1,301 grams in February. Females ranged from 1,029 grams in May to 1,199 grams in March. Averaging the twelve monthly figures gives roughly 1,208 grams for males and 1,108 grams for females, against about 1,251 and 1,130 grams in 2008-09.
So the drop was modest: around 40 grams for males and 20 for females. What stands out more is how flat the line was. The gap between the lightest and heaviest month was 154 grams for males in 2009-10, down from 212 grams the year before. For females it shrank from 216 grams to 170.
Hogg drew one comparison worth repeating. The last time the population estimate sat near this level, in 2005-06, weights were also on the low side. The report doesn’t claim one causes the other, and neither do we. A busy season and a lean one can overlap for any number of reasons, and a single season’s report can’t separate them.
Both sexes were heaviest in late summer, as moult time approached. For a sense of what those grams mean for an individual bird, our guide to what a healthy pre-moult weight looks like goes into it.
Microchips, chick IDs and bands from 1993
The team microchipped 248 penguins for the first time in 2009-10: 62 males, 99 females, nine birds whose sex wasn’t certain and 78 chicks. That was the highest total in the seven seasons the report’s table covers. The written summary compares it with about 250 in 2005-06, although the same table lists 224 new microchips for that season.
The chick figures were where the report sounded proudest. The share of chicks given an ID climbed over three seasons:
- 2007-08: 11.4 per cent of chicks
- 2008-09: 17.05 per cent
- 2009-10: 27.5 per cent
Why does that matter? A bird microchipped as a chick carries a known hatching season for the rest of its life. Miss it, and it turns up later as an anonymous adult. The report suspected exactly that had happened. The number of newly microchipped females, well ahead of males, suggested many were immature birds: chicks from the season before that had slipped through without an ID.
Older identification was still in the mix too. Volunteers were catching penguins first banded in 1993, along with many banded between 1994 and 2000 that were hard to catch. Those bands could only come off when the birds came ashore to moult, because moulting penguins are much quieter to handle. Our explainer on how researchers tell individual penguins apart covers what a long banding record can reveal, and our look at the volunteer monitoring and banding work at St Kilda shows what a night on the rocks involves.
What the evening guides saw on the rocks
The 2009-10 season was also when the penguin guide programme was extended, with the birds watched every evening for six months. Having guides on the breakwater night after night paid off in two ways. They reported penguin behaviour the team had never seen before, which the report promised to describe in the volunteer monitoring team’s newsletters. And they found tangled birds.
The guides rescued and reported many penguins caught in fishing line, ring pulls, plastic bags and other rubbish. Hogg’s conclusion was blunt: the colony was probably losing more birds to rubbish entanglement than anyone had assumed. That fits the wider picture, since discarded fishing line and plastic packaging rings are both recognised entanglement hazards for the little penguin as a species. Our article on how marine plastic and fishing line injure penguins covers the damage in more detail.
Toxin work had started as well. Feather samples were being analysed for toxins, with the team hoping to publish results soon, and blood sampling for toxic analysis was in progress.
Then came the puzzle of the repeat captures. Some penguins near the letters D, L, J, K and M were caught as many as 11 times in the season. Were their burrows shallower and easier to reach, or were those birds losing their fear of people? The report didn’t know, but argued it should be looked into, because the colony ought to stay as wild as possible. We think that instinct was spot on.
The season’s best story came from letter N, on the outer seawall. A pair that first arrived on the breakwater in 2004 was washed out completely by storms twice, kept trying, and raised a single chick at the third attempt. By April they were back in their burrow. Hogg called them very feisty and noted, a little dryly, that this was one pair nobody would be catching 11 times in a season.
How the 2009-10 St Kilda penguin report compares with today
Sixteen years on, the colony still lives on the same breakwater, but a lot has changed around it. Parks Victoria’s page on the St Kilda little penguins describes the pier and breakwater as home to approximately 1,400 little penguins. Viewing is now run by Phillip Island Nature Parks as free sessions you book ahead, two a night, from a 150-metre elevated boardwalk at the end of the pier that opened in October 2025.
It’s tempting to line 1,215 up against 1,400 and call it growth. We’d hold back. The 2009-10 number was a single-season estimate whose method the report doesn’t describe, and today’s figure is a rounded public one. Both describe a colony of well over a thousand birds, and that’s the fair comparison. For how St Kilda’s numbers sit next to a far bigger colony, see our article comparing colony size and monitoring with Phillip Island.
Some themes carry straight through, though. Parks Victoria says the boardwalk was built after growing visitor numbers began disturbing nesting areas, which is a close cousin of the worry the report raised about birds becoming too used to people. Our guide to how penguin viewing works at the breakwater explains what a visit looks like now.
Frequently asked questions
Where can I find the 2010-11 St Kilda penguin report?
We haven’t found a surviving copy. The old site’s 2010-11 report and a separate breakwater penguin report were never archived, so this 2009-10 report is the closest record we can offer from that run of season reports.
How many penguins were at St Kilda in 2009-10?
The report estimated 1,215, with evidence of breeding at 262 sites. Today Parks Victoria puts the colony at approximately 1,400 little penguins.
What does “chicks with ID” mean in the report?
It’s the share of the season’s chicks that were microchipped as chicks, so each carries a permanent identity from early in life. It reached 27.5 per cent in 2009-10, up from 11.4 per cent two seasons earlier.
Why would a penguin be caught 11 times in one season?
The report offered two possibilities: shallower burrows that make some birds easy to reach, or penguins growing less wary of people. It didn’t settle the question and recommended looking into it.